Datum CMDB Pro
Datum CMDB Pro turns ServiceNow CMDB findings into a sequenced plan of ServiceNow tasks. Watch the 50-second demo, see the estimates, and start a no-cost pilot.
ServiceNow gives customers substantial tools to improve their CMDB. The harder part is turning those signals into a coordinated plan. Datum CMDB Pro connects findings into a diagnosis, sequences the work, and puts each action into ServiceNow as a task the customer’s team can pick up.
Datum CMDB is built by Datum AI and delivered by EFS Now, the ServiceNow practice of EFS Networks. Pro runs read-only against the CMDB and makes zero CMDB writes.
Watch Datum turn one finding into the right first task
50 seconds, no sound. A roadmap preview on sample data from Ridgeline Manufacturing, a fictional company with a 23,356-record CMDB.
Nine findings. Which one first?
A health score can list these. It cannot tell you the order to fix them in. Sample data.
| Finding | Records | Severity |
|---|---|---|
| CMDB Health is not turned on, so there is no baseline score | – | Medium |
| Duplicate server CIs from overlapping discovery | 1,284 | High |
| Network devices with no identification rules | 2,410 | Medium |
| Servers sitting in the generic server class | 3,120 | High |
| Linux servers matched on hostname only | 1,906 | Medium |
| Two data sources updating the same server CIs | 2,775 | High |
| Custom tables feeding the CMDB with no mapping | 14 tables | Medium |
| VMware records not seen in 90+ days | 2,038 | Medium |
| Asset table with no owner | 1 table | Low |
Findings in. A sequenced plan out. Every step a ServiceNow task.
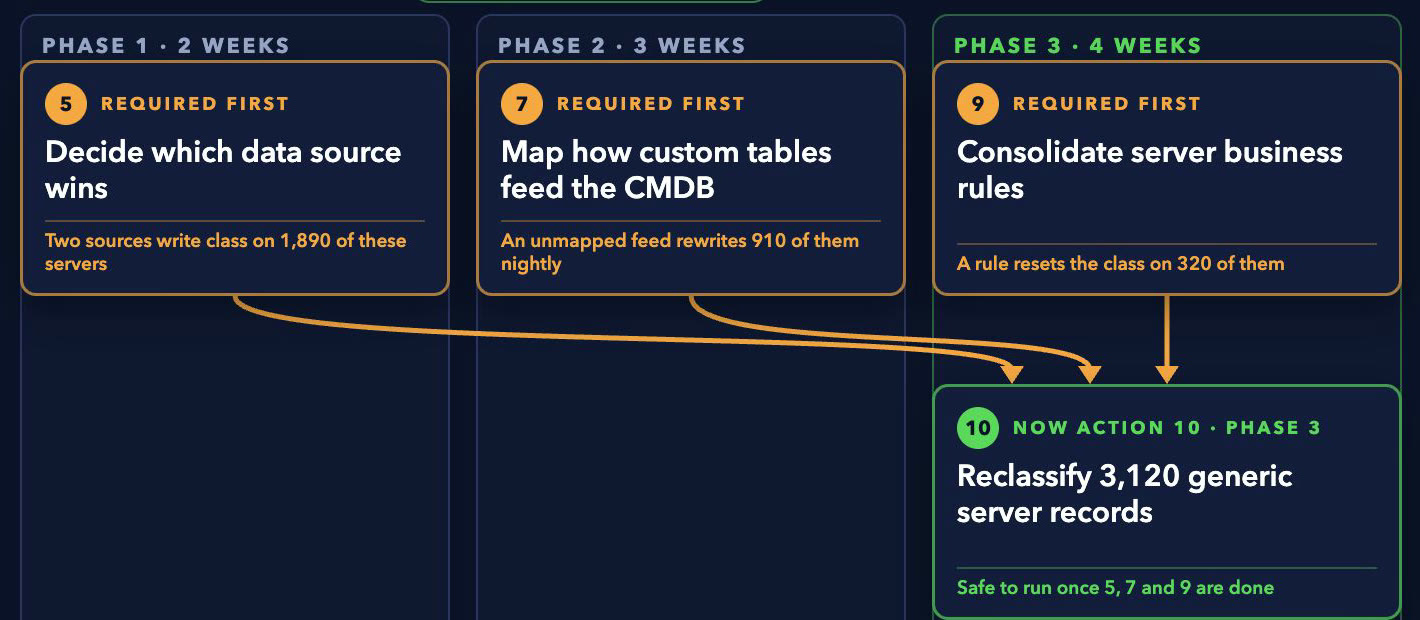
Reclassifying 3,120 generic servers is the obvious fix — and it would not stick. Three causes keep pushing those servers back. Datum finds them, puts them first, and holds the reclassification until they are done.
Action 5 · Phase 1 · 2 weeks
Decide which data source wins
Two sources write class on 1,890 of these servers.
Action 7 · Phase 2 · 3 weeks
Map how custom tables feed the CMDB
An unmapped feed rewrites 910 of them nightly.
Action 9 · Phase 3 · 4 weeks
Consolidate server business rules
A rule resets the class on 320 of them.
Action 10 · Phase 3 · now
Reclassify 3,120 generic server records
Safe to run once 5, 7 and 9 are done.
On the numbers: start with the sample company
Estimates, not forecasts. For any one customer we replace the defaults with their own incident and cost figures.
~$35,000
a year
Estimated cost of CMDB-related incident delay for a 23,356-record CMDB.
~$24,000
in customer staff time
One-time effort to fix the underlying records: about 320 hours at $75 an hour. Not a fee.
~8 months
payback
Time for the fix to pay for itself at those estimates.
How the estimates move across CMDB sizes and assumptions
A bad CMDB costs real money every year · darker = larger
A1 Cost grows with CMDB size
| Records | 0.1% | 0.25% | 0.5% | 1% | 2.5% |
|---|---|---|---|---|---|
| 23,356* | $7K | $18K | $35K | $70K | $175K |
| 100,000 | $30K | $75K | $150K | $300K | $750K |
| 500,000 | $150K | $375K | $750K | $1.5M | $3.8M |
| 1,000,000 | $300K | $750K | $1.5M | $3.0M | $7.5M |
| 5,000,000 | $1.5M | $3.8M | $7.5M | $15M | $38M |
A2 Slower incidents cost more
| Extra h / incident | $50 | $75 | $100 | $150 | $250 |
|---|---|---|---|---|---|
| 1 h | $6K | $9K | $12K | $18K | $29K |
| 2 h | $12K | $18K | $23K | $35K | $58K |
| 4 h | $23K | $35K | $47K | $70K | $117K |
| 8 h | $47K | $70K | $93K | $140K | $234K |
| 16 h | $93K | $140K | $187K | $280K | $467K |
A3 Downtime is the big lever
| Extra outage h / yr | $10K | $50K | $100K | $250K | $1.0M |
|---|---|---|---|---|---|
| 1 h | $10K | $50K | $100K | $250K | $1.0M |
| 2 h | $20K | $100K | $200K | $500K | $2.0M |
| 4 h | $40K | $200K | $400K | $1.0M | $4.0M |
| 8 h | $80K | $400K | $800K | $2.0M | $8.0M |
| 24 h | $240K | $1.2M | $2.4M | $6.0M | $24M |
A4 Paid-for licenses sit idle
| Subscription / yr | 1 mo | 3 mo | 6 mo | 12 mo | 18 mo |
|---|---|---|---|---|---|
| $100K | $8K | $25K | $50K | $100K | $150K |
| $250K | $21K | $63K | $125K | $250K | $375K |
| $500K | $42K | $125K | $250K | $500K | $750K |
| $1.0M | $83K | $250K | $500K | $1.0M | $1.5M |
| $5.0M | $417K | $1.3M | $2.5M | $5.0M | $7.5M |
Estimates. Defaults: 4 extra hours per incident at $75; 0.5% of records behind an incident a year. * 23,356-record baseline.
The fix can pay for itself within a year · green = within a year, or 3×+
B1 Fixing by hand costs more
| Records to fix | 5 min | 10 min | 15 min | 30 min | 60 min |
|---|---|---|---|---|---|
| 3,120* | $20K | $39K | $59K | $117K | $234K |
| 10,000 | $63K | $125K | $188K | $375K | $750K |
| 50,000 | $313K | $625K | $938K | $1.9M | $3.8M |
| 100,000 | $625K | $1.3M | $1.9M | $3.8M | $7.5M |
| 500,000 | $3.1M | $6.3M | $9.4M | $19M | $38M |
B2 Bigger CMDBs pay back faster
| Records | $24K | $100K | $250K | $1.0M | $5.0M |
|---|---|---|---|---|---|
| 23,356* | 8.2 mo | 34.3 mo | 85.6 mo | 10+ yr | 10+ yr |
| 100,000 | 1.9 mo | 8.0 mo | 20.0 mo | 80.0 mo | 10+ yr |
| 500,000 | < 1 mo | 1.6 mo | 4.0 mo | 16.0 mo | 80.0 mo |
| 1,000,000 | < 1 mo | < 1 mo | 2.0 mo | 8.0 mo | 40.0 mo |
| 5,000,000 | < 1 mo | < 1 mo | < 1 mo | 1.6 mo | 8.0 mo |
B3 Payback by rework avoided
| Rework avoided | 0.1% | 0.25% | 0.5% | 1% | 2.5% |
|---|---|---|---|---|---|
| 10% | 10+ yr | 10+ yr | 82.2 mo | 41.1 mo | 16.4 mo |
| 25% | 10+ yr | 65.8 mo | 32.9 mo | 16.4 mo | 6.6 mo |
| 50% | 82.2 mo | 32.9 mo | 16.4 mo | 8.2 mo | 3.3 mo |
| 75% | 54.8 mo | 21.9 mo | 11.0 mo | 5.5 mo | 2.2 mo |
| 100% | 41.1 mo | 16.4 mo | 8.2 mo | 4.1 mo | 1.6 mo |
B4 Benefit per $1 of fix, 3 years
| Fix cost / record | 0.1% | 0.25% | 0.5% | 1% | 2.5% |
|---|---|---|---|---|---|
| $0.25 | 3.6× | 9.0× | 18.0× | 36.0× | 90.0× |
| $1.03* | 0.9× | 2.2× | 4.4× | 8.8× | 21.9× |
| $2.00 | 0.5× | 1.1× | 2.3× | 4.5× | 11.3× |
| $5.00 | 0.2× | 0.5× | 0.9× | 1.8× | 4.5× |
| $10.00 | 0.1× | 0.2× | 0.5× | 0.9× | 2.3× |
Estimates, incident rework only. Fix = remediation effort with Datum’s plan (baseline ≈ 320 h at $75 internal = $24K). * Baseline.
What leaves the customer’s instance? The shape of the CMDB. Not what’s in it.
1
The records stay.
Server names, IP addresses, serial numbers, owners, locations and people never leave ServiceNow. Datum counts records. It does not read them.
2
Only the structure leaves.
Table and field definitions, rules, counts and health scores go to an AWS environment set up for that one customer. They are not used to train AI.
3
Need more control? There are options.
For customers with stricter requirements, running the analysis side in their own AWS account is available on request.
Next step: see it on a real CMDB. A no-cost pilot, run together.
01
Start with one CMDB
One where ITOM, Service Mapping or AI is licensed but held up by the data.
02
A read-only assessment
Results the same day. No CMDB writes. Only the structure described here leaves.
03
A sequenced plan
Findings turned into ordered ServiceNow tasks the customer’s team can run.
Demo and figures use sample data and estimates. ServiceNow is a trademark of ServiceNow, Inc.
Let's talk about what you're building.
Our team brings over two decades of experience to every engagement. Tell us about your project and we'll show you what's possible.
Let's talk about what you're building.
Our team brings over two decades of experience to every engagement. Tell us about your project and we'll show you what's possible.